Building a Production-Grade T-Pot Sensor on Proxmox: Lab Topology and Cowrie Hardening
How I deployed a T-Pot 24.04.1 honeypot behind OPNsense on Proxmox, hardened Cowrie's deception surface, and started collecting six-figure daily attack volumes.

TL;DR
- Deployed T-Pot 24.04.1 as an LXC container on a dedicated Proxmox lab node, isolated in a DMZ VXLAN behind an OPNsense firewall.
- All TCP ports 0–64000 are DST-NAT’d from the public interface to the sensor, exposing the full T-Pot service stack to the internet.
- Hardened Cowrie’s deception surface with a custom
honeyfs/, a realistic enterprise hostname pattern, and a believable Ubuntu 22.04 / OpenSSH 8.9p1 fingerprint.- First event captured 2026-04-13T18:41:31Z. Cumulative volume across ~21 days is dominated by Honeytrap (991k) and Cowrie (482k).
- This post is the lab cornerstone and a reference for follow-up posts that will analyze the data.
Why a Honeypot Lab
I am transitioning from a sysadmin role with cybersecurity responsibilities into a Security Operations Center (SOC) analyst track. Reading detection content is not the same as having to triage it. A T-Pot deployment exposed to the public internet generates a continuous, real-world stream of opportunistic attack telemetry that I can use to:
- Practice triage on volumes a homelab can realistically sustain.
- Build, test, and tune detection content (Sigma, Suricata, KQL) against real adversary behavior rather than synthetic test data.
- Maintain a public, reproducible portfolio of analysis.
This post documents the deployment so the analysis posts that follow have a single canonical reference for the environment.
Environment
Sensor: T-Pot 24.04.1 (full edition, all honeypots enabled) Host: Proxmox VE 9.1.7, dedicated lab node LXC resources: 2 vCPU, 16 GiB RAM, 125 GiB disk, single VXLAN-attached NIC Perimeter: OPNsense VM on a separate Proxmox node Exposure: DST-NAT, TCP 0–64000 → sensor Collection window referenced in this post: 2026-04-13T18:41:31Z → 2026-05-04T00:00:00Z (~21 days)
Honeypot data is biased toward opportunistic, internet-wide scanning and commodity malware. Findings drawn from this sensor should not be extrapolated to targeted-threat baselines or to internal east-west traffic.
Lab Topology
The lab spans two Proxmox nodes. Production-style services (firewall, DNS, media, storage) live on the main node. Anything experimental or intentionally exposed lives on a second, isolated node. Only the perimeter firewall and the sensor are relevant to this post; other VMs are omitted from the diagram for clarity.
flowchart LR
    Internet((Internet))
    subgraph N1[Proxmox Node 1 - Core]
      OPN[OPNsense Firewall VM]
    end
    subgraph N2[Proxmox Node 2 - Lab]
      TPOT[T-Pot 24.04.1<br/>LXC, DMZ VXLAN]
    end
    Internet -- "TCP 0-64000" --> OPN
    OPN -- "DST-NAT to sensor<br/>DMZ VXLAN" --> TPOT
    OPN -. "LAN segment<br/>10.0.LAN.0/24<br/>(no route to DMZ)" .- LAN[Internal LAN clients]
Two design choices worth flagging:
- The sensor is on a separate Proxmox node from the firewall. A compromise of the LXC container should not give the attacker a foothold on the same hypervisor as my core services. The two nodes communicate over a VXLAN overlay, but the DMZ has no route to the LAN segment.
- The DMZ is a VXLAN, not a flat VLAN. This keeps the broadcast domain isolated from the rest of the lab fabric and makes it trivial to extend to additional sensors without re-cabling.
The DMZ has no return path to the LAN. The OPNsense rule set permits only inbound DST-NAT to the sensor and explicit egress for sensor updates and image pulls. Egress filtering is critical: a misconfigured honeypot can become an outbound attack platform.
Exposure: Why 0–64000
The default T-Pot footprint binds dozens of services across a wide port range. Honeytrap in particular acts as a low-interaction catch-all that can dynamically respond on arbitrary TCP ports. To let the sensor see the full opportunistic-scanning surface — rather than only the canonical ports — I DST-NAT TCP 0–64000 from the OPNsense WAN to the sensor.
Ports 64001–65535 are intentionally excluded so I retain headroom for management and out-of-band tooling on the firewall itself.
If you replicate this, do not enable IPS mode on the WAN-facing OPNsense interface for the DST-NAT’d range. Suricata in blocking mode will silently drop the very traffic the honeypot exists to collect.
Cowrie Hardening
Out-of-the-box Cowrie is fingerprintable. The default hostname (svr04), the default filesystem pickle, and the default banner are well known to attacker tooling and to public Shodan/Censys scans. A sensor that announces itself as a honeypot collects less interesting data because skilled operators disconnect on first contact.
I made two categories of changes: the deception identity (cowrie.cfg) and the deception filesystem (honeyfs/).
Deception identity
Selected fields from etc/cowrie.cfg, with the values that matter for fingerprinting:
1
2
3
4
5
6
7
8
9
10
11
12
13
14
15
16
17
18
19
[honeypot]
hostname = srv-<role>-<env>-01
auth_class = UserDB
userdb_file = etc/userdb.txt
timezone = Europe/London

[shell]
arch = linux-x64-lsb
kernel_version = 5.15.0-91-generic
kernel_build_string = #101-Ubuntu SMP Tue Nov 14 13:30:08 UTC 2023
hardware_platform = x86_64
operating_system = GNU/Linux
ssh_version = OpenSSH_8.9p1, OpenSSL 3.0.2 15 Mar 2022

[ssh]
version = SSH-2.0-OpenSSH_8.2p1 Ubuntu-4ubuntu0.11
ciphers = aes128-ctr,aes192-ctr,aes256-ctr,aes256-cbc,aes192-cbc,aes128-cbc,3des-cbc
macs = hmac-sha2-512,hmac-sha2-256,hmac-sha1
auth_attempts = 5
Reasoning, field by field:
hostnamefollows asrv-<role>-<env>-NNpattern that mirrors how a real corporate sysadmin labels production hosts. The published pattern here is genericized; the actual sensor uses a specific role and environment that I am keeping out of the post to preserve the deception value.KernelandOSstrings are aligned to a plausible Ubuntu 22.04 LTS host. Cowrie defaults are older and easy to flag.ssh_versionin[shell]andversionin[ssh]are deliberately set to two different but consistent OpenSSH builds. Real Ubuntu hosts will report the packaged build in the SSH banner; the in-shellssh -Voutput is what an attacker sees after login. Keeping these consistent with a real Ubuntu 22.04 system reduces fingerprinting.ciphersandmacsare restricted to a set that a hardened-but-not-paranoid production server would actually negotiate. The Cowrie default cipher list is broader than reality and is itself a tell.auth_attempts = 5mirrors typical productionMaxAuthTries. The Cowrie default invites unrealistic password floods.
Deception filesystem
I replaced the default honeyfs/ with a hand-curated tree:
1
2
3
4
5
6
7
8
9
10
11
12
13
14
15
16
17
18
19
20
honeyfs/
├── etc/
│   ├── group
│   ├── host.conf
│   ├── hostname
│   ├── hosts
│   ├── inittab
│   ├── issue
│   ├── motd
│   ├── passwd
│   ├── resolv.conf
│   └── shadow
└── proc/
    ├── cpuinfo
    ├── meminfo
    ├── modules
    ├── mounts
    ├── net/
    │   └── arp
    └── version
Each file is populated with content consistent with the declared kernel and OS version. The point is not to fool a sophisticated operator indefinitely — it is to survive the first 30 seconds of reconnaissance commands (uname -a, cat /etc/os-release, cat /proc/cpuinfo, cat /etc/passwd) that commodity scripts run before deciding whether to drop a payload.
The realism bar I am aiming for is “survives an automated dropper’s pre-flight checks,” not “fools a human red teamer.” Most of the value of a honeypot at this volume comes from automated traffic, and automated tooling rarely looks past the first handful of recon commands.
Pipeline Overview
T-Pot’s internal pipeline is unchanged from the upstream 24.04.1 build. Each honeypot writes structured logs that are shipped via Logstash into the bundled Elasticsearch instance and visualized in Kibana.
flowchart LR
    A[Cowrie / Honeytrap / Dionaea / etc.] --> B[Container log volumes]
    B --> C[Logstash<br/>parse and enrich]
    C --> D[(Elasticsearch)]
    D --> E[Kibana dashboards]
    D --> F[Ad-hoc jq / KQL queries<br/>for analysis posts]
For analysis posts I will work primarily from Kibana for visualization and from raw cowrie.json and Elasticsearch queries for anything that needs to be reproducible.
Initial Volume Snapshot
First event observed: 2026-04-13T18:41:31Z. Cumulative event counts across the ~21-day window, by sensor:
| Sensor | Events |
|---|---|
| Honeytrap | 991k |
| Cowrie | 482k |
| Sentrypeer | 318k |
| Dionaea | 206k |
| Mailoney | 31k |
| Heralding | 25k |
| Tanner | 12k |
| Adbhoney | 9k |
| H0neytr4p | 7k |
| ConPot | 4k |
Counts are rounded and reflect the cumulative window from first event to publication. Honeytrap dominates because it acts as a generic TCP catch-all across the full DST-NAT’d range; one Honeytrap event does not equate to one meaningful interaction. Sentrypeer’s volume is consistent with the SIP scanning visible in the port distribution below (UDP/TCP 5060). Note that Honeytrap and H0neytr4p are distinct tools: Honeytrap is the catch-all TCP responder, while H0neytr4p is a separate HTTP-focused honeypot.
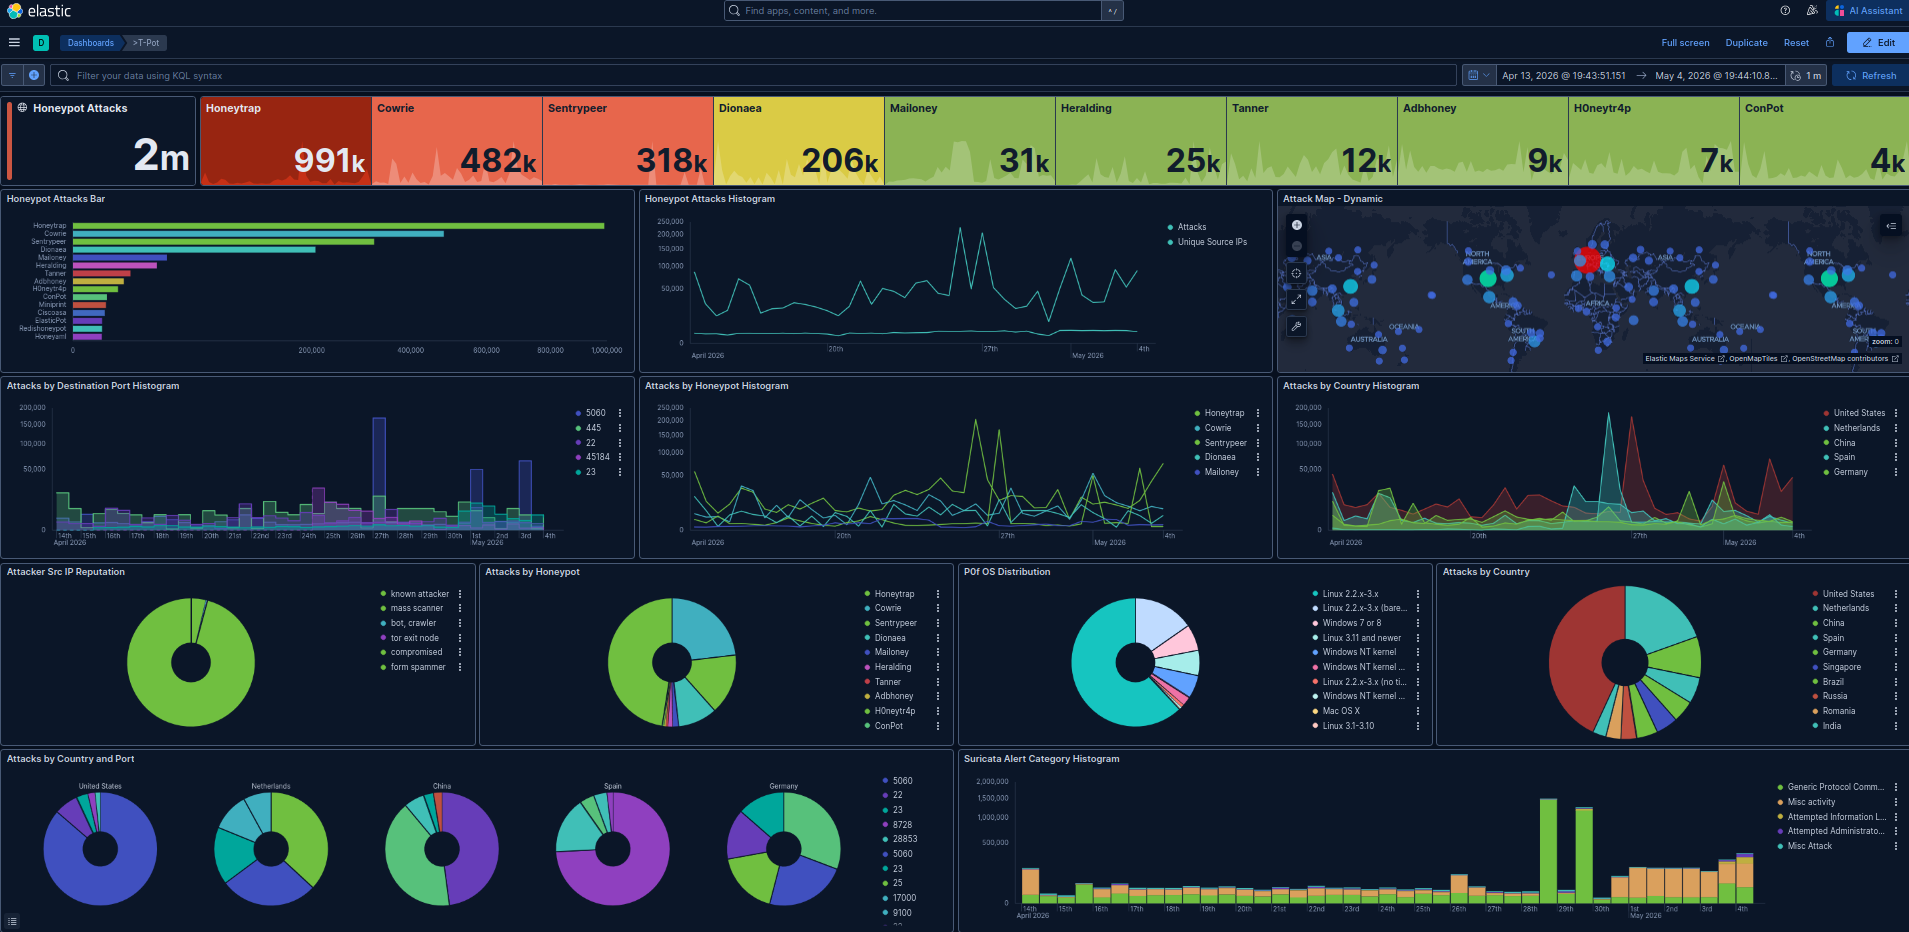 T-Pot Kibana overview, 2026-04-13 → 2026-05-04 UTC. 2M events, top sensor (omitting Honeytrap): Cowrie, top source country: United States.
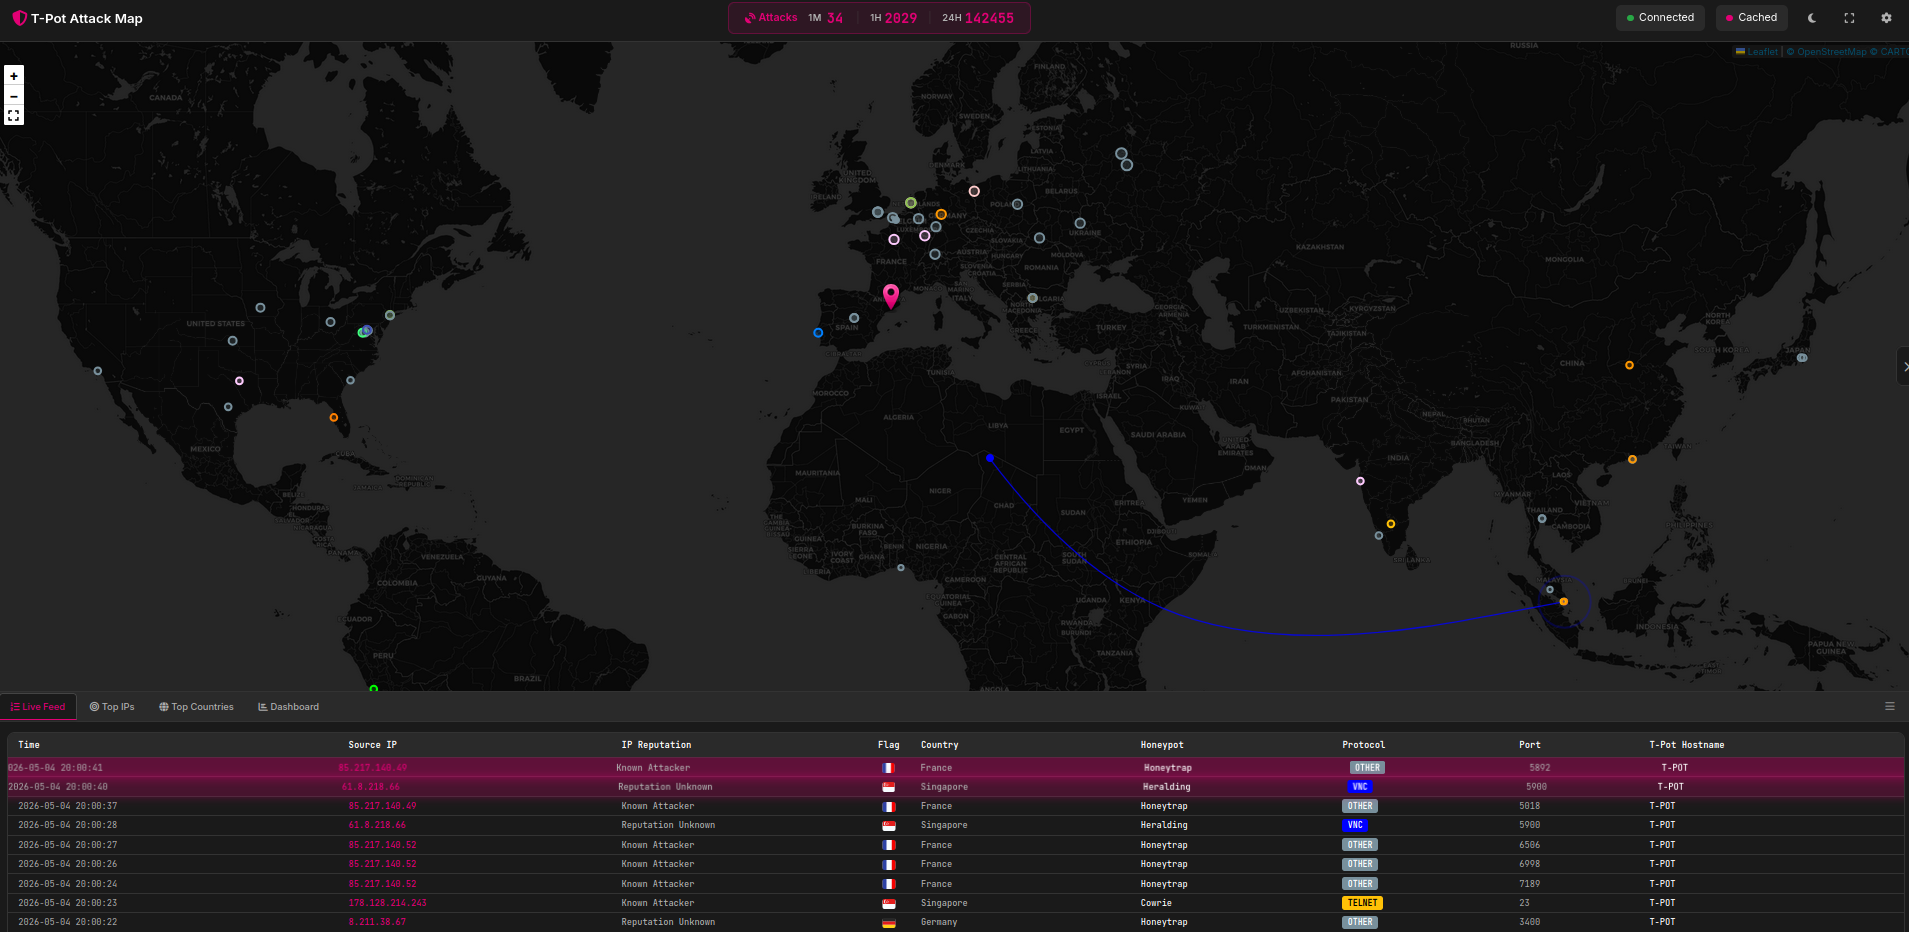 T-Pot live attack map.
Top Ports and Credentials
A read of the highest-signal credential and port telemetry across the 21-day window. The dedicated Cowrie deep dive will publish the full IoC CSV, daily breakdowns, and a Sigma rule; this section is scoped to what is needed to sanity-check the lab and orient follow-up analysis.
Top usernames (Cowrie)
| Username | Count |
|---|---|
root | 57,125 |
ubuntu | 2,419 |
sa | 1,873 |
345gs5662d34 | 1,217 |
admin | 1,118 |
postgres | 714 |
deploy | 594 |
user | 567 |
test | 526 |
ftpuser | 323 |
root outweighs the next entry by more than 23×, which is consistent with commodity SSH/Telnet brute-force tooling that does not vary the username. The presence of sa (Microsoft SQL Server’s default sysadmin account) and postgres in the top 10 suggests scanners are probing Cowrie expecting a database-host fingerprint, which is useful confirmation that the deception identity is at least plausible at the credential layer. The string 345gs5662d34 is a long-documented default credential associated with embedded-device firmware seen in IoT botnets; it appears as both a username and a password in this dataset, which is the canonical signature of that scanner family.
Top passwords (Cowrie)
| Password | Count |
|---|---|
| (empty) | 1,752 |
123456 | 1,498 |
3245gs5662d34 | 1,238 |
345gs5662d34 | 1,217 |
admin | 604 |
123 | 570 |
password | 453 |
12345678 | 332 |
1234 | 292 |
12345 | 224 |
P@ssw0rd | 223 |
nPSpP4PBW0 | 114 |
The empty password is the single most common value, indicating that a meaningful share of inbound traffic is probing for null-authentication misconfigurations rather than guessing credentials. nPSpP4PBW0 and the 345gs5662d34 family are pre-canned strings from specific scanner builds, not creative attempts. A handful of entries in the long tail of the export are not credentials at all but HTTP request fragments (GET / HTTP/1.1, Accept: */*, Host: <sensor-public-ip>:23) — the result of HTTP scanners hitting the Telnet port and Cowrie parsing the request line as a username/password pair. That artifact is itself useful for detection content: any auth attempt where the credential field contains an HTTP method or header is, by definition, malformed protocol traffic and a high-confidence indicator of indiscriminate scanning.
The
<sensor-public-ip>placeholder above stands in for an IP that appeared in scanner-supplied HTTP Host headers and is being treated as sensitive infrastructure data until verified otherwise.
Top destination ports by source country
| Country | Dest. Port | Count |
|---|---|---|
| United States | 5060 | 286,911 |
| Spain | 45184 | 56,917 |
| United States | 22 | 22,459 |
| China | 22 | 22,043 |
| China | 445 | 18,871 |
| Spain | 6089 | 12,328 |
| United States | 23 | 10,869 |
| Netherlands | 25 | 7,147 |
| United States | 8728 | 6,863 |
| Netherlands | 5060 | 5,400 |
| United States | 28853 | 5,146 |
| Spain | 445 | 3,149 |
| Germany | 445 | 3,173 |
| Netherlands | 23 | 3,178 |
| Spain | 55912 | 2,926 |
| China | 28853 | 2,635 |
| Germany | 5060 | 2,390 |
| Netherlands | 17000 | 2,107 |
| Germany | 25 | 1,869 |
| Germany | 22 | 1,476 |
| Germany | 23 | 1,393 |
| Netherlands | 9100 | 1,534 |
| Spain | 32924 | 1,371 |
| China | 1433 | 1,167 |
| China | 23 | 1,277 |
A few patterns are worth pulling out for downstream analysis:
- Port 5060 (SIP) from the United States dominates the entire dataset at 287k events, which directly explains Sentrypeer’s third-place position in the sensor table. This is consistent with public reporting on SIPVicious-family VoIP fraud reconnaissance and is the strongest single signal in the lab so far.
- Port 8728 (MikroTik RouterOS API) and port 28853 appear from US sources at non-trivial volume. RouterOS API targeting is a well-documented vector; 28853 is less common and warrants a follow-up post.
- China-sourced traffic concentrates on 22 (SSH), 445 (SMB), and 1433 (MSSQL) — the canonical credential-brute-force triplet. This aligns with the
saandrootusername distribution above. - Spain accounts for an outsized share of high-numbered ports (45184, 55912, 32924, 6089). These do not map cleanly to common services and likely reflect either ephemeral-port responder traffic, a regional scanner population, or honeypot proximity to the source. I am flagging this as an open question rather than drawing a conclusion.
A downloadable CSV of the full IoC set (top 50 usernames, top 50 passwords, complete country/port matrix) will ship with the Cowrie deep-dive post.
Detection Engineering Hooks
This post is a lab build, so the artifact it ships is the deployment itself. Concrete detection content lands in the analysis posts that follow. Planned next artifacts:
- A Sigma rule for credential-stuffing patterns observed against the sensor.
- A Suricata signature tuned for the specific Mirai-family scanner behavior visible in Honeytrap.
- A KQL query, written for Microsoft Sentinel, that translates honeypot-derived IoCs into a watchlist-driven detection.
Limitations
- Single sensor, single network vantage. All conclusions drawn from this data are about traffic that reaches one residential broadband IP. They are not representative of enterprise-edge or cloud-edge baselines.
- No ground truth on attribution. Source IPs and ASNs can be reported, but attribution to named threat actors is not possible from this data alone and will not be claimed.
- Honeytrap inflation. Honeytrap’s catch-all behavior generates a much higher event count per actual attacker session than Cowrie or Dionaea. Sensor-to-sensor comparisons need to account for this.
- Cumulative window. The volume snapshot is cumulative since first event, not a rolling 24-hour figure. Daily figures will appear in the analysis posts.
References
- T-Pot Community Edition — https://github.com/telekom-security/tpotce
- Cowrie SSH/Telnet honeypot — https://github.com/cowrie/cowrie
- Proxmox VE — https://www.proxmox.com/en/proxmox-virtual-environment/overview
- OPNsense — https://opnsense.org/
- MITRE ATT&CK — https://attack.mitre.org/
Changelog
- 2026-05-04 — Initial publication.
See the about page for this site’s AI assistance policy.